Viewing app usage details by team
Understand and take action on app usage by team
Compare teams based on app usage and spend in the Team details table on the Teams page for an application.
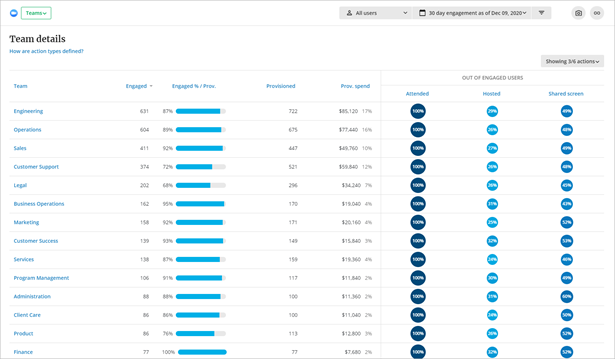
For each team name, the table shows the number of engaged users or unique logins, the number of provisioned users or an estimate of total users, and a mini pill chart to indicate the team’s relative usage during the selected window of time. Hover over the chart to see details. Click the chart segment to open a list of users included in that segment.
For apps with an engagement connector and contract information, the Provisioned spend column shows the amount as the number of provisioned licenses multiplied by the annual contract amount per license. Allocate a portion of app costs back to the team using the percentage, which represents the team’s relative consumption of all of the organization’s licenses.
The Team details table is further broken down into actions specific to that application. Actions performed by more users show a bigger, darker bubble. Actions performed by fewer users show a lighter, smaller bubble. Click the bubble to open a list of users who performed that action.
Select How are action types defined? at the top of the table to view a popup of how actions are mapped to the events from the application.
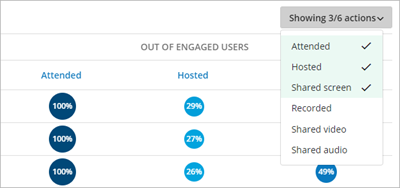
To change the actions displayed in the table, select the Actions filter to see how teams used each action. Selected actions are highlighted and shown as columns on the table.
The Team details table can be sorted by clicking any table column header.
Select Download team data as .csv at the bottom of the table to send data to a .csv file. The .csv file includes additional details.