Working with messaging apps
Learn more about engagement with messages
Learn how a messaging tool promotes communication and collaboration on the Messages page for a messaging application.
Message feature use for an app is collected through its engagement connector.
To open the Messages page, open the app you want to view, and select the Messages tab.
The Messages page presents visualizations to show how users in your organization have used the selected application during the selected date/window of time.
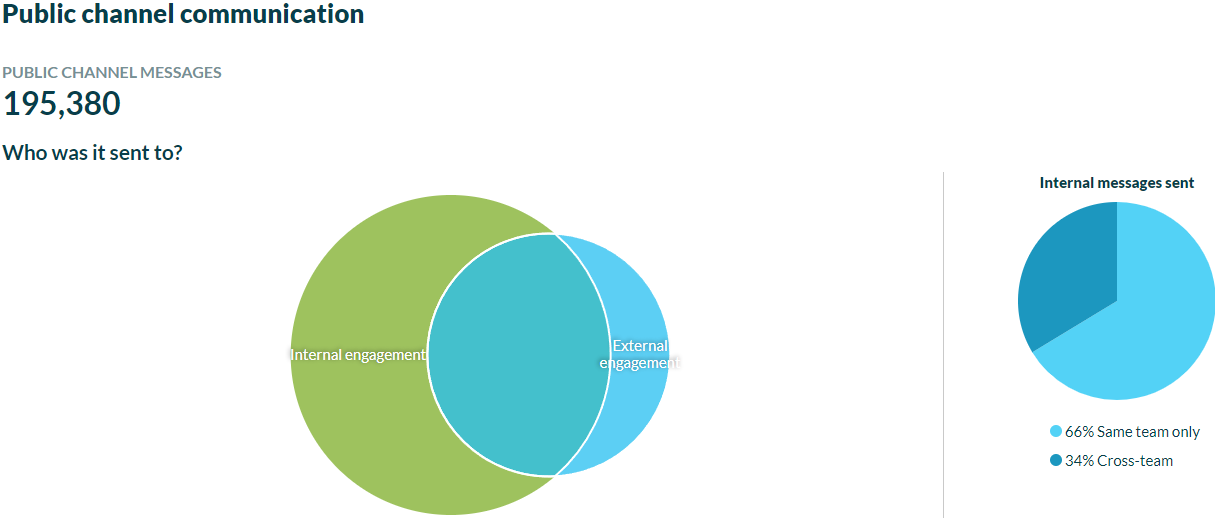
Learn what kind of communications your organization is having with the Public channel communication pie charts and Venn diagrams. Learn about the number of internal vs. external messages and the messages within the same team or with other teams within the organization.
Track trends for changes in how people have used the app to send messages in the Communication over time chart. Use this data to inform education efforts for improving communication behaviors in your organization, such as using messages to share information across teams.
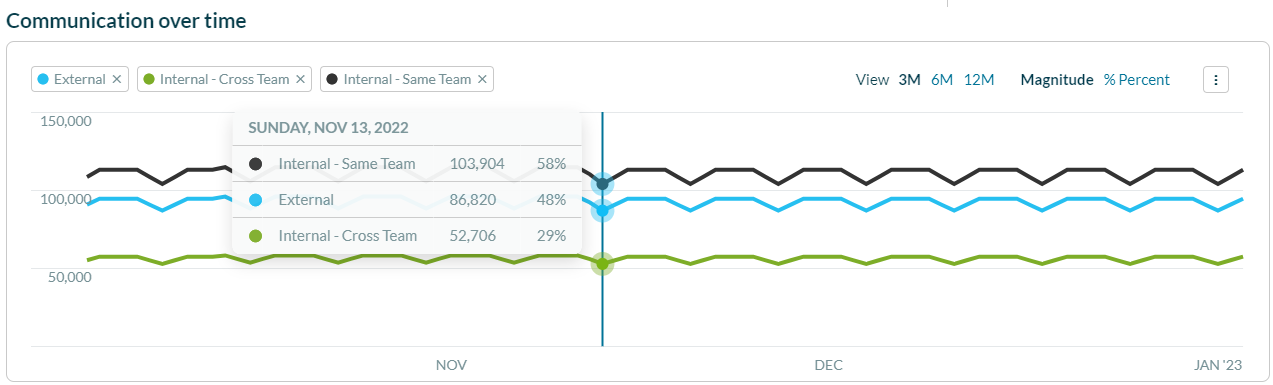
View any annotations by selecting the annotation markers at the bottom of the chart. Application Admins and Productiv Super Admins can add a new annotation to the chart.
To see the usage trend over a different time period, select 3 months, 6 months or 12 months.
To switch between the number of users and a percentage of provisioned users, select the Magnitude or %/Provisioned Users label.
Filter the chart by the type of message by selecting the labels at the bottom of the chart.
Select Download trends as .csv to send data to a .csv file.